Imagine checkout latency suddenly doubles.
A monitoring alert tells the team that p95 response time has crossed its normal range. That is useful, but it does not explain whether the slowdown comes from the checkout service, database, payment provider or something else.
An engineer inspects several slow requests and discovers that almost all the extra time is being spent inside one call to the inventory service. The logs from that service then reveal repeated database connection timeouts immediately before those requests fail.
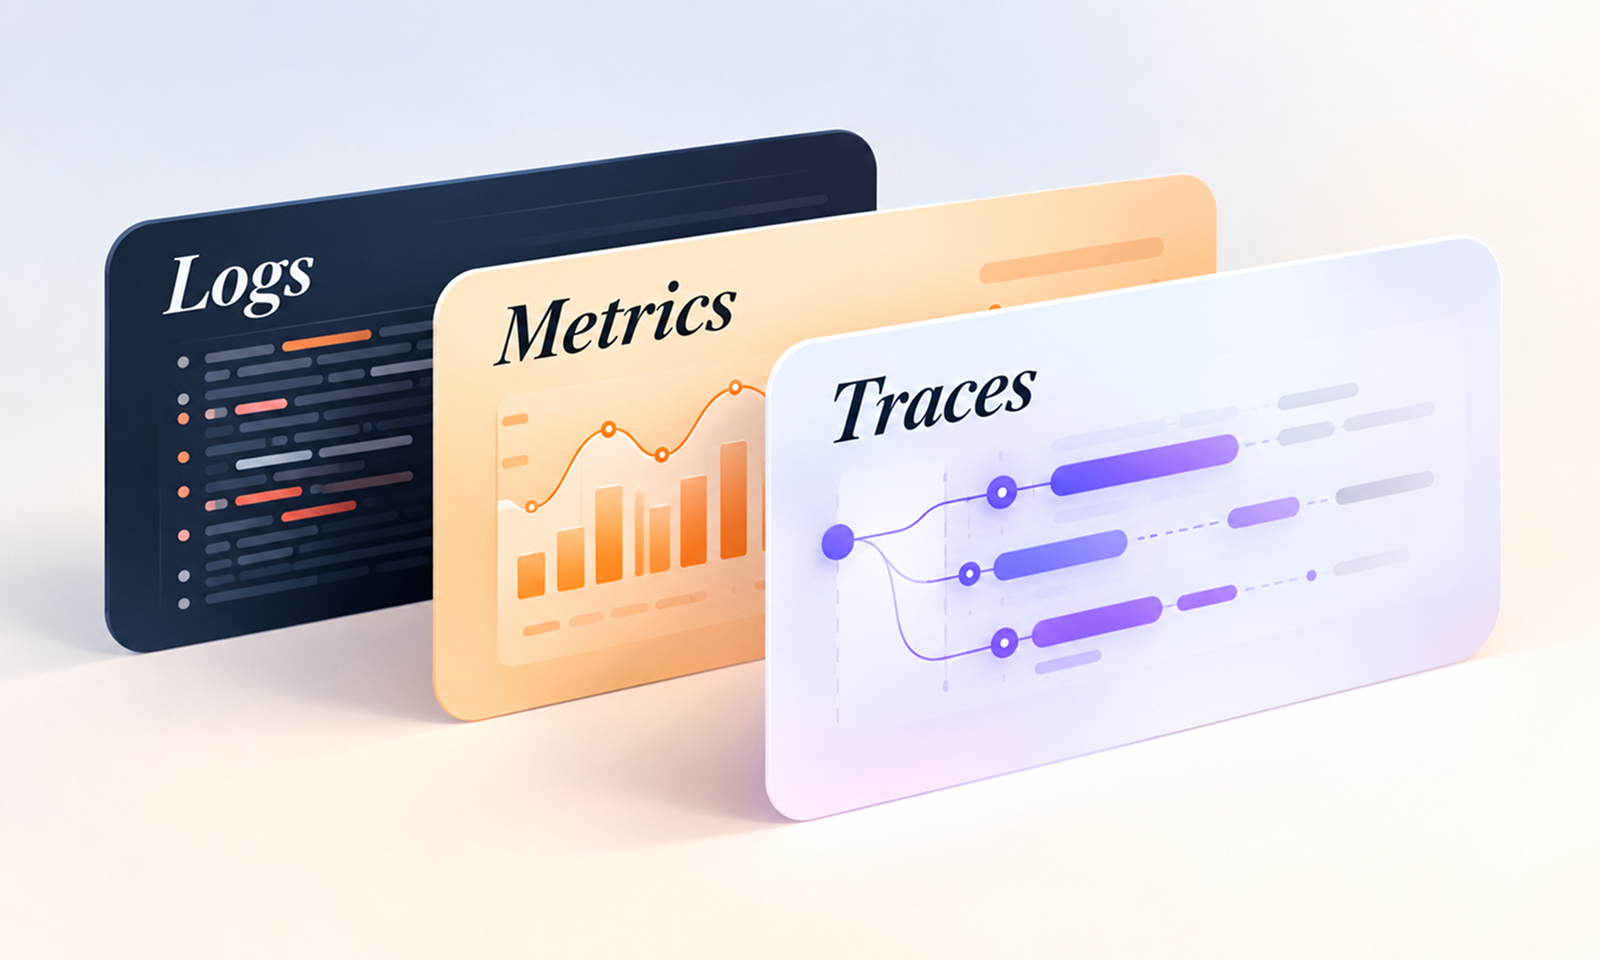
Three kinds of information have answered three different questions.
The metric showed that something abnormal was happening across the system.
The trace showed where the time was being spent during individual requests.
The logs provided detailed evidence about what happened inside the problematic component.
This is the practical value of logs, metrics and traces.
They are often described as the foundations of application observability because each provides a different view of application behaviour. Used independently, they can leave important gaps. Properly correlated, they allow teams to move from “something is wrong” toward “this is what happened, where it happened and what we should investigate.”
OpenTelemetry formalises these as distinct telemetry signals: a metric is a runtime measurement, a log records an event, and a trace describes the path of a request through an application.
For Levelworks, this capability sits primarily within the Observable aspect of App Health, while the ability to use that information to investigate problems strengthens Explainable & Debuggable.
The important question is not whether your application produces all three signals.
It is whether they work together well enough to help you understand production behaviour.
[Internal Link: “Application Monitoring vs Observability: What’s the Difference?”]
The simplest way to understand the three signals is by looking at the questions they are good at answering.
Signal
Best at answering
Example
Metrics
What is happening across the system?
Checkout error rate rose from its normal baseline
Traces
Where did this request spend its time or fail?
1.6 seconds of a slow checkout occurred inside the payment call
Logs
What happened inside a component at a particular moment?
Payment request failed because the provider returned a specific error
There is overlap between them.
A log can contain response duration. A tracing system can aggregate spans to reveal latency trends, while a metric may carry labels identifying a service or endpoint.
That does not make the signals interchangeable.
Their different data structures make each one better suited to particular kinds of questions.
Metrics turn application behaviour into numerical measurements that can be compared over time.
Examples include:
OpenTelemetry defines metrics broadly as measurements captured at runtime, with its metrics specification designed to collect and aggregate measurements efficiently. OpenTelemetry: Metrics
Their greatest strength is aggregation.
Suppose an application processes five million API requests in a day. Engineers rarely want to inspect five million individual records to determine whether performance is deteriorating.
A metric can instead show p95 latency by hour, error rate by endpoint or queue depth over the course of the day.
That makes metrics particularly useful for:
Google's Site Reliability Engineering guidance recommends focusing particularly on latency, traffic, errors and saturation for user-facing services because together they reveal demand, performance, failure and proximity to resource constraints. Google SRE: Monitoring Distributed Systems
Aggregation is also the main limitation.
A chart can tell you that payment latency increased at 14:05. It may not tell you why.
Imagine p99 latency has increased from 700 milliseconds to 2.4 seconds.
Was one database query responsible?
Did an external API slow down?
Did a new deployment affect one service?
Are a small number of unusually slow requests distorting the tail?
The metric tells you where to begin investigating. Other telemetry often provides the detail needed to continue.
That is why a useful observability system should not stop at a wall of charts.
Logs record events generated by applications and infrastructure.
A useful application log might tell you that an order-processing job started, an authorization check failed, an external API returned an error or a database operation exceeded an expected duration.
According to OpenTelemetry's logging documentation, logs are timestamped records that may be structured or unstructured, with structured logs preferred for production analysis because a consistent schema makes them easier to search, process and correlate with other telemetry.
Consider two error messages.
The first says:
Payment failed
The second records:
Both describe the same failure.
Only one gives an engineer much to work with.
This is why the value of logging is not determined by how many messages an application produces. It depends on whether the logs contain useful, consistent context.
Metrics are excellent for questions such as:
How often is authentication failing?
Logs are better suited to:
What happened during this particular authentication failure?
They can preserve details that would be impractical or expensive to represent as metric dimensions.
This makes logs useful for investigating:
They are also valuable when engineers do not know in advance exactly which detail they will need during an investigation.
Applications can produce enormous quantities of low-value logging.
A system that records every tiny internal operation may make the important events harder to find while increasing storage and processing costs.
The opposite problem is equally common: important failures are represented by messages too vague to investigate.
Good logging should therefore be intentional.
The question is not:
“How much can we log?”
It is:
“If this operation fails in production, what information would we need to understand what happened?”
That deeper subject deserves its own treatment.
[Internal Link: “How Better Logging Makes Apps Easier to Maintain”]
Traces become particularly valuable as an application is divided across multiple components.
Suppose one user action triggers:
The user experiences one action: Place Order.
The application performs work across several systems.
A distributed trace connects those operations into one request journey.
OpenTelemetry describes a trace as the path of a request through an application. Each individual operation is represented as a span, allowing engineers to see which components participated and how long each operation took.
For example:
POST /checkout 1,820 ms
├── Validate user 35 ms
├── Create order 70 ms
├── Query inventory 110 ms
└── Process payment 1,540 ms
└── External provider 1,490 ms
The trace immediately changes the investigation.
Instead of treating “checkout is slow” as one large problem, the team can see that almost all the latency sits inside the payment operation.
AWS describes application traces similarly: a trace records a request as it passes through services and dependencies, while individual spans represent the operations inside that request. AWS CloudWatch: Application Traces
In a monolithic application, a developer may sometimes be able to reconstruct an operation from one set of logs.
Distributed applications make this harder because a user action can cross multiple services, queues and external systems.
The W3C Trace Context standard exists specifically to standardise how identifying context is propagated between components so a distributed request can remain connected as it moves through different systems.
Without that continuity, engineers may know that several services produced errors at roughly the same time without knowing whether those errors belonged to the same transaction.
Tracing gives the request a story.
Traces are excellent for examining the path of individual transactions, but they do not automatically answer every operational question.
A trace may show exactly why one request took four seconds. It does not necessarily tell you whether the problem affects 0.01% or 30% of requests.
Metrics provide that population-level context.
Likewise, a trace may reveal that an operation returned an error without containing the detailed application context explaining why. Logs can provide that evidence.
There are practical trade-offs as well. High-volume systems may not retain every trace because of telemetry volume and cost, which makes sampling strategy important. Instrumentation gaps can also cause traces to stop at service boundaries.
Tracing is therefore powerful precisely because it complements other signals rather than replacing them.
Logs, metrics and traces become much more useful when engineers can move between them without manually reconstructing relationships.
Return to the checkout problem.
A useful investigation might look like this:
An alert reports that checkout p95 latency has doubled.
The team can see when the increase began, how many requests are affected and whether error rates changed at the same time.
Engineers select several slow checkout traces from the affected period.
Each shows unusually long calls to the inventory service.
The investigation has moved from “checkout is slow” to “the inventory operation is responsible for most of the additional latency.”
From the relevant trace or span, engineers open correlated inventory-service logs.
Those records show that several requests waited for database connections and eventually timed out.
The investigation can now move toward the connection pool, database health or whatever is causing that pressure.
The three signals have progressively reduced uncertainty.
This is exactly why OpenTelemetry places so much emphasis on correlation. Its logging model can include trace and span identifiers so logs emitted during a request can be connected directly to the corresponding trace. OpenTelemetry Logging Specification
AWS similarly describes the benefit of shared OpenTelemetry attributes as the ability to correlate metrics, logs and traces when moving from detection toward root cause. AWS CloudWatch and OpenTelemetry
This is the difference between having three telemetry systems and having observability.
Correlation depends on shared context.
Useful common attributes may include:
The exact attributes depend on the application.
Consistency matters more than collecting every possible field.
If a metric refers to the service as payments-api, logs call it payment-service-prod, and traces use another naming convention altogether, investigations become unnecessarily difficult.
OpenTelemetry's semantic conventions exist partly to standardise naming and meaning across spans, metrics, logs and events so telemetry from different components can be interpreted consistently.
The principle remains useful even when an organisation does not adopt every convention formally:
the same thing should have the same identity across your telemetry.
Observability projects can easily become tool projects.
A team buys a logging platform, installs an APM agent, enables several hundred default metrics and assumes the application is now observable.
Instrumentation should instead begin with the questions engineers need to answer.
For a payment workflow, those might be:
Those questions suggest the signals required.
You might need a metric for success rate, traces through the payment path and logs containing provider responses or internal error categories.
OpenTelemetry's observability guidance defines proper instrumentation in similarly practical terms: applications should emit enough telemetry that developers can investigate unexpected behaviour without first needing to modify the application simply to gather more information. OpenTelemetry: Observability Primer
That is a stronger standard than “we have logging enabled.”
Not every function needs its own custom span, metric and log record.
Instrumentation is especially useful around boundaries where an application interacts with something whose behaviour matters independently:
These boundaries are often where latency accumulates and failures propagate.
Automatic instrumentation can cover many common frameworks, network clients and databases. OpenTelemetry also supports code-based instrumentation where teams need additional business or application context beyond what infrastructure-level instrumentation can provide. OpenTelemetry: Instrumentation
The right balance avoids two extremes: an application that reveals almost nothing internally and one that emits so much telemetry that important evidence becomes difficult or expensive to use.
A system can produce terabytes of logs and still be difficult to understand.
Likewise, hundreds of metrics do not help if none describes the workflow that is actually failing, while traces with inconsistent service names can leave a transaction looking fragmented.
Good observability depends on the quality and relationship of signals.
For each signal, ask:
Signal
Useful question
Metrics
Which changes in system behaviour would we want to notice?
Logs
What details would we need when investigating an individual event?
Traces
Which request paths need to be understood across component boundaries?
Correlation
Can we move between these views without guessing which records belong together?
That last question is easy to underestimate.
An observability platform becomes much more useful when an engineer can start with a latency alert, open a representative trace and jump directly to logs from the relevant request.
The tooling matters less than maintaining that investigative continuity.
Telemetry has operational costs of its own.
Adding every user ID, request ID or arbitrary value as a metric label can create extremely high cardinality, making metric storage and querying more expensive or less efficient. Detailed logging can generate huge volumes of data, while retaining every trace in a high-traffic application may be unnecessary.
Different signal types are suited to different kinds of detail.
Metrics generally work best with dimensions whose possible values are controlled and analytically useful. High-detail context often fits better in logs or traces, where teams can inspect individual events when necessary.
Tracing systems may also use sampling to control volume, although the correct approach depends on traffic, risk and what kinds of transactions the organisation cannot afford to miss.
The objective is not maximum telemetry retention.
It is enough usable evidence to answer important production questions at a reasonable operational cost.
Logs and traces can accidentally capture information that should not be stored there.
Request bodies may contain personal information, access tokens or payment data. Error messages can expose credentials or internal details, while trace attributes added casually by developers can create similar problems.
Instrumentation should therefore include clear rules about what can and cannot be recorded.
That is particularly important because telemetry tends to be copied into separate platforms, retained for long periods and made searchable by engineering or operations teams.
Observability should improve App Health without creating a new security or compliance weakness in the process.
The simplest way to evaluate your telemetry is not to count how many signals you collect.
Pick a real production question.
Suppose a user says:
“My order failed at 10:42 this morning.”
Can your telemetry answer:
Metrics, traces and logs each contribute different pieces of that answer.
If the information exists but engineers have to manually search three systems using timestamps and intuition, correlation can improve.
If a trace identifies the failing service but no useful application log exists there, logging can improve.
If one request is understandable but the team cannot tell whether the problem is widespread, metrics can improve.
This is a more meaningful assessment of observability than asking whether each telemetry technology has been installed.
Within Levelworks' App Health framework, logs, metrics and traces primarily make an application more Observable.
Their value does not end there.
Useful diagnostic context improves Explainable & Debuggable because engineers can understand why unexpected behaviour occurred. Performance metrics support Performant and Scalable by revealing latency and capacity trends, while integration traces and errors can make deterioration in Integrable visible.
After a release, the same telemetry can help teams determine whether a change created a regression, supporting healthier Tested and Seamlessly Updatable practices.
This is why observability is best understood as an enabling capability rather than a collection of dashboards.
[Internal Link: “How to Find the Root Cause of Application Errors Faster”]
Logs, metrics and traces are valuable because they preserve different kinds of information.
Metrics compress large amounts of behaviour into trends that make abnormalities visible.
Traces preserve the journey of individual requests so teams can see where time was spent and where failure occurred across component boundaries.
Logs preserve detailed events that help explain what happened inside those components.
Used separately, each leaves unanswered questions.
Used together—and connected through consistent context—they allow teams to move naturally from detecting a problem to narrowing it down and understanding its cause.
That is the real foundation of application observability.
Not three telemetry products running next to one another, but three complementary views of the same application that help the people maintaining it understand what production is actually doing.