At 10:17, checkout starts failing for a small percentage of customers.
The application is still online. Infrastructure looks normal, most requests are succeeding and nobody on the engineering team receives an alert.
At 10:42, the first customer contacts support.
Another report arrives a few minutes later. Someone from support posts in Slack, engineering begins investigating, and only then does the team discover that a payment-provider timeout has been affecting transactions for almost half an hour.
The problem did not begin when the first customer complained.
That was simply when the organisation became aware of it.
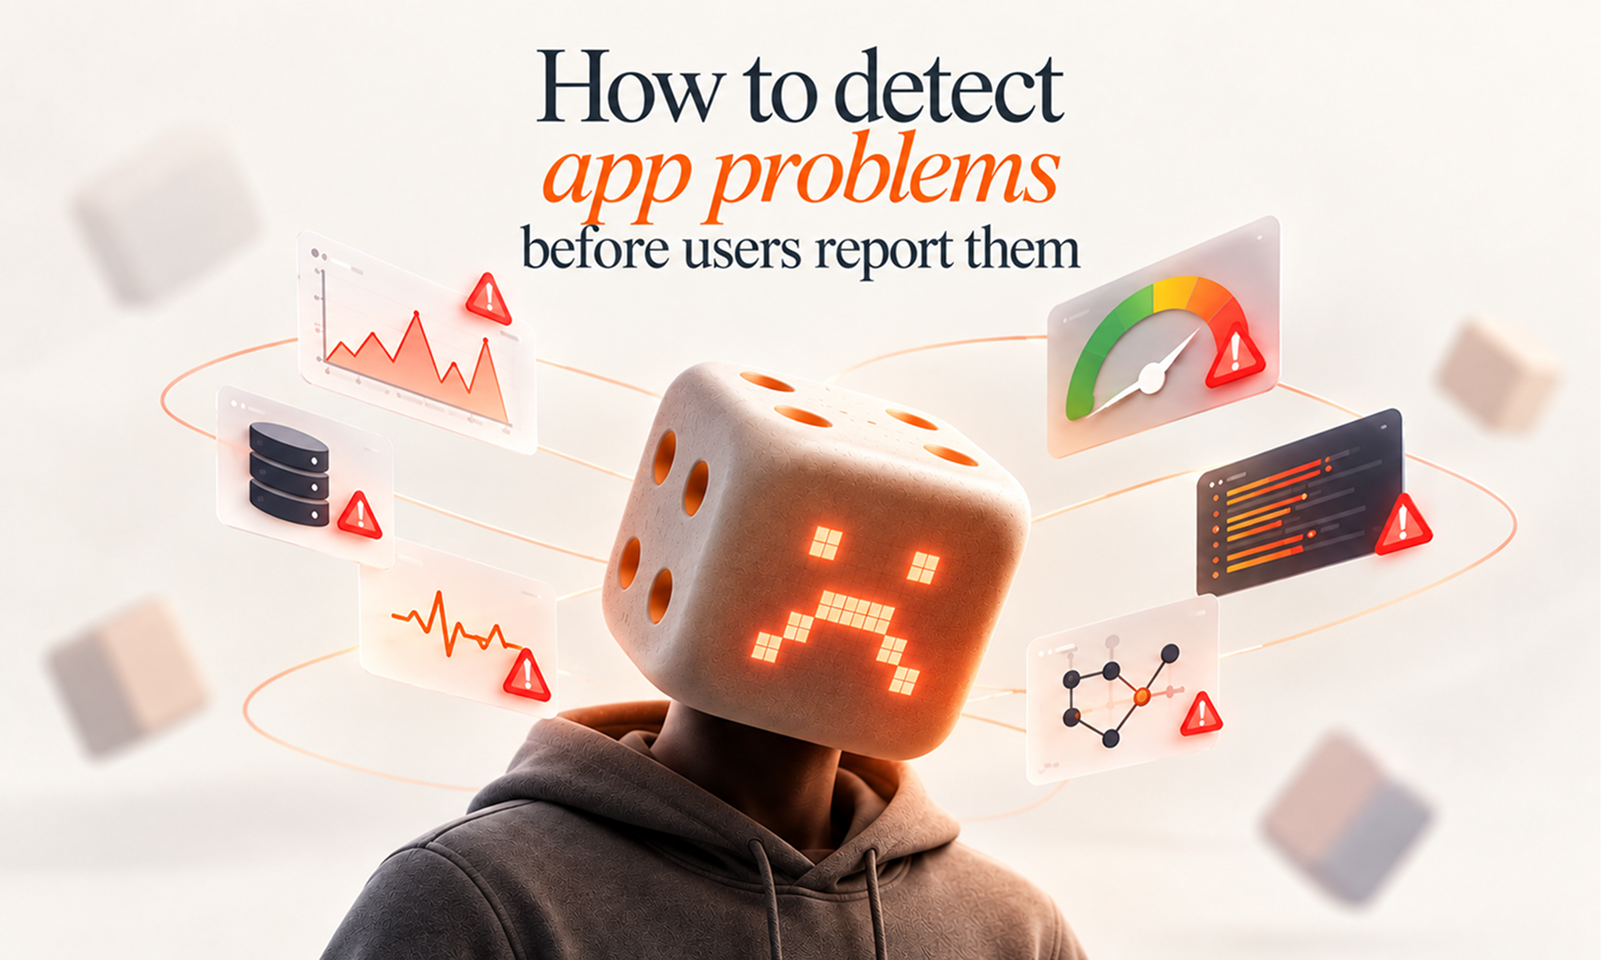
This gap between failure occurring and the team detecting it is one of the most useful things production monitoring can reduce.
Users should not be your primary monitoring system.
Customers will inevitably uncover unusual edge cases, but routine degradation—failed transactions, rising latency, stuck jobs, integration failures or a release regression—should usually become visible through the application itself.
AWS goes so far as to list user-reported issues as an anti-pattern when discussing application telemetry, because it indicates that proactive detection through telemetry and business KPIs may be inadequate.
The goal is not to predict every bug before it exists.
It is to build enough visibility that when production begins moving away from normal behaviour, your systems notice before enough users do.
Early detection begins with a simple question:
What can go wrong that would matter to a user or the business?
That is more useful than beginning with whatever metrics your infrastructure platform exposes by default.
A commerce application may need to know whether customers can:
A SaaS platform might care about account login, report generation, file processing or whatever workflow creates the product's core value.
Monitor those outcomes directly where possible.
For example, rather than monitoring only whether the checkout API responds, measure whether checkout attempts actually complete successfully.
AWS recommends defining workload metrics around business outcomes and warns that teams can monitor every technical component while still being unable to determine whether the workload is delivering its intended business result.
This is often how teams detect problems earlier.
A drop in successfully processed orders may surface an issue before CPU, memory or infrastructure availability changes enough to trigger anything.
[Internal Link: “Application Monitoring: What Should You Monitor in a Production App?”]
An alert cannot tell you much if you have never defined what acceptable behaviour looks like.
Suppose checkout normally succeeds 99.5% of the time. If success falls to 98.2%, that difference may deserve attention even though the system is technically processing almost every transaction.
Similarly, API latency increasing from 300 ms to 700 ms may matter in a service that normally stays around 250–350 ms, even if somebody previously chose an arbitrary alert threshold of two seconds.
Baselines allow teams to detect change, not just catastrophic failure.
Useful baselines may include:
OpenTelemetry notes that application telemetry accumulated over time helps establish baselines and identify anomalies in system behaviour.
The best thresholds therefore come from understanding how the application normally behaves and what level of deterioration creates meaningful risk.
They should not be copied blindly from another product.
Many user-impacting problems develop gradually.
An API does not suddenly go from 200 ms to unavailable. Latency may increase over several days.
A database does not have to run out of connections before it becomes a problem. Waiting time can increase as the pool approaches saturation.
A queue may continue processing work while the backlog grows faster than workers can clear it.
Google's Site Reliability Engineering guidance recommends monitoring latency, traffic, errors and saturation because these signals reveal different forms of deterioration before a system necessarily becomes unavailable.
The principle is especially important for early detection.
Ten failures mean something very different when you processed 100 requests versus 10 million.
Monitor rates and segment them around important workflows, endpoints or services.
Also pay attention to the type of error.
A slight increase in harmless validation failures may be less important than a handful of failed payments or authorization errors.
Averages can conceal a bad experience affecting a smaller percentage of users.
If most requests complete quickly while 5% take several seconds, the average may still look respectable.
Percentiles such as p95 or p99 can expose that tail.
CPU at 100% is obvious.
A database connection pool that rises from 50% utilisation to 85% over several months is more interesting from a preventive perspective.
The useful question is:
Are we moving toward a constraint that will eventually affect users?
This is where the Observable, Performant and Scalable aspects of Levelworks' App Health framework intersect.
Detection should reveal not only failures that already exist but also conditions that are steadily creating them.
One of the most direct ways to detect user-facing problems early is to test important journeys continuously.
Synthetic monitoring does this by running scripted transactions against the live application.
A synthetic check might:
Amazon CloudWatch describes synthetic canaries as scheduled scripts that follow the same routes and perform the same actions as customers, allowing organisations to verify the customer experience even when there is no real user traffic. AWS explicitly notes that this can expose problems before customers encounter them.
Microsoft's Application Insights offers a similar model through recurring availability tests that call applications or APIs from different locations and alert when an endpoint stops responding or becomes too slow.
Synthetic checks are particularly useful for:
They can catch a failure at 3:00 a.m. even if no customer happens to use the affected function until 8:00.
Checking that / returns HTTP 200 provides only shallow assurance.
If customers cannot authenticate, complete checkout or submit the application's main workflow, the application can be functionally broken while its homepage remains perfectly reachable.
Design synthetic checks around user outcomes, not merely URLs.
[Internal Link: “Real User Monitoring vs Synthetic Monitoring: Which Does Your App Need?”]
Synthetic monitoring gives you controlled, repeatable checks.
Real User Monitoring shows what actual customers experience across the messy conditions you cannot easily reproduce.
Users arrive with different:
A synthetic test might confirm that your dashboard opens quickly from a high-speed connection in one region while real customers on older devices experience serious delays.
Google recommends using field or RUM data when measuring Core Web Vitals because it captures performance from actual users in real-world conditions rather than only controlled environments.
Real-user signals can uncover patterns such as:
This is why synthetic and real-user monitoring work best as complementary detection methods.
Synthetic monitoring asks:
“Can a known workflow succeed right now?”
RUM asks:
“What are users actually experiencing across the population?”
Not every important failure happens during a user request.
A scheduled job may stop processing invoices. A data synchronization process could fail overnight, while messages accumulate in a queue because one worker has stopped consuming them.
The application may remain perfectly responsive while the consequences build quietly in the background.
For important asynchronous work, monitor signals such as:
The age of unfinished work can be especially useful.
A queue containing 2,000 messages might be normal during peak traffic if those messages clear within thirty seconds. A queue containing only 200 messages can be more serious if the oldest has been waiting for two hours.
Similarly, avoid monitoring scheduled jobs only through failure messages.
If a scheduler stops invoking the job altogether, there may be no failure event to report.
Monitoring “time since last successful completion” catches that different failure mode.
Your own application can be healthy while something it depends on is deteriorating.
Payment processors, identity providers, databases, DNS services, email platforms and external APIs can all cause user-facing failures.
AWS recommends implementing dependency telemetry specifically so teams can observe reachability, latency, timeouts and other behaviour of the external systems on which a workload depends.
For significant dependencies, watch:
Suppose an external API normally responds within 300 ms but gradually rises above a second.
You would rather know while your application is still tolerating the delay than after requests start exceeding your own timeout and failing for customers.
This is also why dependency health should be measured from your application's perspective.
A provider's public status page can say everything is operational while your account, region or specific endpoint experiences trouble.
A surprising number of problems can be detected quickly by asking one question:
What changed immediately before this metric changed?
Production monitoring becomes far more useful when deployments, configuration changes and feature rollouts are visible alongside application behaviour.
Suppose error rates rise at 14:07 and the latest release completed at 14:03.
That does not prove the release caused the problem, but it gives the team a much stronger starting point.
Monitor important health signals before and after deployment:
DORA's software-delivery framework measures deployment instability through signals such as change fail rate and deployment rework rate, reflecting whether production changes require immediate intervention, rollback or additional corrective deployments.
For early detection, the practical lesson is straightforward:
Do not deploy and then stop looking.
A release should create a short period of increased attention around the signals most likely to reveal regressions.
Static thresholds are useful when there is a clear boundary.
Disk space below a particular amount may require action. A certificate approaching expiry has an objective deadline.
Other behaviour varies with time.
Traffic may normally be much higher on Monday mornings than Sunday nights. Report-generation latency could increase predictably during the final day of every month.
A fixed alert threshold can either trigger constantly during normal peaks or be set so high that genuine deterioration goes unnoticed.
Where behaviour is variable, compare current conditions with historical patterns.
That might mean detecting:
Anomaly detection can help, but it should not become an excuse to outsource judgement to an algorithm.
Teams still need to decide which deviations actually matter.
A strange metric is not automatically a problem.
A strange metric associated with a critical user outcome may be.
Monitoring data does not create early detection if nobody sees the right signal in time.
AWS identifies alarm thresholds that provide insufficient time to react as a monitoring anti-pattern. Its reliability guidance recommends continuously monitoring workload health so technical failures or degradation become visible as soon as possible.
A useful alert should answer:
Avoid alerting on every unusual measurement.
If teams receive hundreds of notifications that rarely require action, they eventually learn to ignore them.
Instead, distinguish between signals that deserve immediate interruption and those better suited to dashboards, daily review or trend analysis.
A steadily shrinking database-capacity margin may deserve planned maintenance.
Checkout failure rates jumping sharply deserve immediate attention.
[Internal Link: “How to Build an Effective Application Alerting Strategy”]
A monitoring configuration can look excellent on paper and still fail when needed.
An alert rule may contain the wrong threshold. A notification could be routed to an abandoned channel, while a synthetic check may test only part of the workflow it is supposed to protect.
Detection mechanisms should therefore be tested.
AWS recommends simulations—often called game days—to verify that monitoring and alarm systems correctly recognise problems.
You do not need to cause a major production incident simply to test an alert.
Controlled exercises might verify what happens when:
The test should confirm the complete detection path:
problem → telemetry → alert condition → notification → responder
If any link is missing, the monitoring system may give false confidence.
If customers repeatedly report important problems first, treat that pattern itself as operational data.
Review recent incidents and record:
This often exposes blind spots quickly.
For example:
Incident
Problem began
Detected internally
First user report
Payment latency
10:17
10:19
10:42
Failed nightly import
01:00
08:45
08:30
Browser-specific UI error
14:10
Not detected
14:22
The first case shows effective early detection.
The second shows that users noticed before the team.
The third reveals a complete monitoring gap.
This turns “we need better monitoring” into something specific enough to improve.
There is no single metric that guarantees you will learn about every problem first.
The strongest setups combine different forms of detection because each catches a different class of failure.
Detection layer
What it can reveal early
Business/workflow KPIs
Critical user outcomes beginning to fail
Synthetic monitoring
Known journeys breaking even without live traffic
Real User Monitoring
Problems affecting actual devices, browsers or user segments
Errors and latency
Service degradation and partial failures
Saturation and capacity trends
Approaching technical limits
Background-job monitoring
Silent asynchronous failures
Dependency telemetry
External-service degradation
Release correlation
Production regressions following changes
Alerts and anomaly detection
Important departures from expected behaviour
That combination is what strengthens Observable within Levelworks' App Health framework.
An observable application is not one that produces a large quantity of telemetry. It is one where important changes in condition become visible soon enough for the team to understand and act on them.
You will never eliminate user-reported problems completely.
Users operate software in ways teams cannot fully predict, and some issues will only appear under circumstances monitoring has never seen before.
The objective is different.
If checkout starts failing, a queue stops moving, an important API becomes slow or the latest release creates a regression, the application should produce enough evidence for your team to notice before support tickets become the detection mechanism.
That means watching what matters to users, understanding normal behaviour, detecting gradual degradation, continuously exercising critical workflows and paying attention to systems outside your direct control.
The best indication that early detection is working is simple:
When a customer eventually reports an important production problem, the response from your team is increasingly:
“Yes, we already saw it.” rather than: “This is the first we've heard of it.”