Application monitoring and observability are often discussed as if they are interchangeable.
They are closely related, but they solve different parts of the same operational problem.
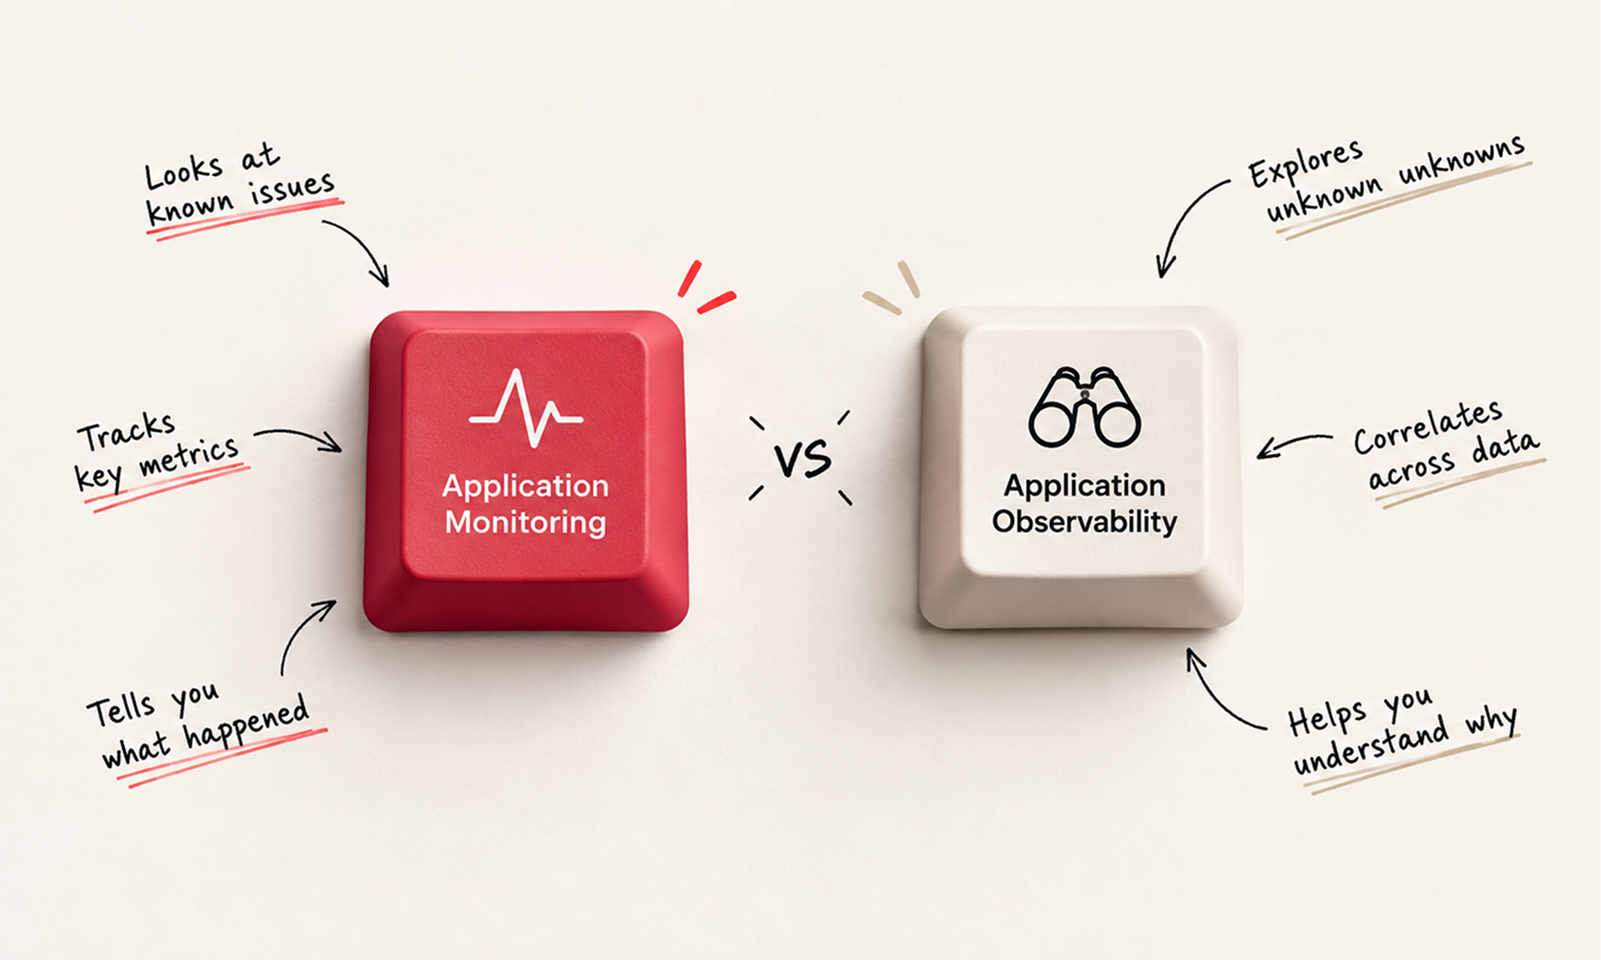
Monitoring tells you whether the application is behaving as expected. Observability gives you enough evidence to investigate why it is behaving differently when something unexpected happens.
That distinction becomes much more important as applications grow beyond a few easily understood components.
A monitoring system might tell you that checkout latency has doubled. An observable application should help you determine whether that delay comes from the checkout service, database, inventory call, payment provider or something introduced in the latest release.
One detects the symptom.
The other helps explain the system producing it.
Application monitoring is the ongoing measurement of known signals that indicate whether an application is functioning normally.
Teams decide what matters, collect measurements and create dashboards or alerts around those conditions.
Typical monitoring might track:
Google's Site Reliability Engineering guidance recommends focusing particularly on latency, traffic, errors and saturation for user-facing services because these signals provide a useful picture of production behaviour. Google SRE: Monitoring Distributed Systems
Monitoring is especially good at answering questions you already know are important.
Is checkout failing?
Has p95 latency crossed our expected range?
Is storage approaching capacity?
Did error rates rise after today's deployment?
This is why monitoring remains essential even in highly observable systems. You still need a dependable way to recognise when normal behaviour changes.
[Internal Link: “Application Monitoring: What Should You Monitor in a Production App?”]
Observability goes further.
OpenTelemetry defines observability as the ability to understand a system from the outside through the telemetry it produces, including the ability to investigate novel or unexpected problems without first having to add new instrumentation. OpenTelemetry: Observability Primer
That last part is important.
Monitoring is strongest when the team has already decided what to watch.
Observability becomes valuable when the question was not known in advance.
Suppose users report that only large enterprise accounts experience slow report generation after a release, while your normal response-time dashboards remain within target.
You may not have an alert specifically for:
Report generation for customers with more than 50,000 records on application version 7.4 is slow.
An observable application gives engineers enough logs, metrics, traces and contextual data to explore that question anyway.
AWS describes the distinction similarly: monitoring collects and reports measurements about system health, while observability takes a broader investigative view of interactions across a distributed system to understand where and why problems occur. AWS: Observability vs Monitoring
It is tempting to present the distinction as:
old approach = monitoring
modern approach = observability
That is misleading.
Observability depends on monitoring and telemetry.
AWS explicitly describes application telemetry as the foundation of observability, with logs, metrics and traces providing diagnostic information about the state of an application and its technical and business outcomes. AWS Well-Architected: Implement Application Telemetry
Microsoft makes a similar point in its Azure Monitor documentation: observability in distributed applications depends on collecting operational data from multiple layers and consolidating it into views that can support analysis and diagnosis. Microsoft Learn: Azure Monitor Data Platform
A more accurate relationship is:
Monitoring detects and tracks known conditions. Observability provides the depth and context required to explore system behaviour—including conditions you did not predict.
You generally want both.
Imagine a SaaS application where users suddenly report slow dashboard loading.
The monitoring system shows:
You now know there is a real problem and roughly when it began.
You inspect traces for slow dashboard requests and see that most of the delay sits inside one customer-data service.
Logs from that service show queries timing out for a particular type of account. Metrics then reveal that the database connection pool for the service has been steadily approaching saturation.
Now the investigation has moved from:
“The dashboard is slow.”
to:
“Requests for a particular workload are waiting for database connections inside the customer-data service.”
Monitoring raised the question.
Observability provided enough connected information to pursue the answer.
[Internal Link: “Logs, Metrics and Traces: The Foundations of Application Observability”]
This is probably the most useful practical distinction.
Monitoring
Observability
Watches predefined signals
Allows deeper exploration of system behaviour
Answers known operational questions
Helps investigate questions that emerge during incidents
Commonly drives dashboards and alerts
Commonly supports diagnosis and root-cause investigation
May look at individual services or metrics
Helps connect behaviour across components
Tells you what changed
Helps determine why it changed
Requires useful thresholds and baselines
Requires rich, correlated telemetry
The boundary is not absolute.
Modern monitoring platforms often include tracing, log correlation and exploratory tools. Observability platforms also provide alerts and dashboards.
The difference is therefore less about the product you buy and more about the questions your telemetry allows engineers to answer.
In a simple application, a user request might enter one server, execute some code, query a database and return.
If something becomes slow, the number of places to investigate is limited.
Modern applications can behave very differently. A single user action may pass through an API gateway, authentication system, multiple services, a database, message queue and external provider.
The user still sees one button.
Engineering sees a chain of dependencies.
Monitoring each component independently might show that every service is technically online while failing to reveal how their interactions produce the user's problem.
This is where traces and shared context become particularly valuable.
OpenTelemetry's observability model is built around correlated telemetry—including traces, metrics and logs—so behaviour can be understood across system boundaries rather than through disconnected signals.
The more distributed the application becomes, the more expensive it is to reconstruct those relationships manually during an incident.
Not necessarily.
A small internal application with a simple architecture may be operated effectively with good monitoring, structured logging and enough diagnostic information for the team to investigate occasional problems.
A customer-facing application made up of many services and third-party dependencies has a much stronger need for distributed tracing, correlation and exploratory analysis.
AWS notes that the appropriate level of logging and monitoring depends on factors such as application criticality, security risk and data sensitivity, with customer-facing and business-critical applications generally requiring deeper visibility. AWS Prescriptive Guidance: Logging and Monitoring for Application Owners
The question is therefore not whether every application needs the most sophisticated observability stack available.
Ask instead:
When an unexpected production problem occurs, do we already have enough information to investigate it?
If engineers routinely need to deploy extra logging before they can understand failures, manually compare timestamps across systems or guess which dependency caused a problem, the application probably needs stronger observability.
Within Levelworks' App Health framework, both primarily strengthen Observable.
Monitoring helps make deterioration visible.
Observability makes that visibility useful during investigation.
The second capability also supports Explainable & Debuggable, because knowing that an error exists is different from being able to trace its cause through the application.
This distinction matters operationally.
An app with excellent alerting but poor diagnostic context may identify incidents quickly and then spend hours understanding them. Another app may produce detailed traces and logs but fail to alert anyone when an important workflow breaks.
Neither setup is complete.
[Internal Link: “How to Find the Root Cause of Application Errors Faster”]
Monitoring and observability overlap enough that arguments over terminology can become more confusing than useful.
For product and engineering teams, the practical difference is straightforward:
Monitoring should tell you when the application moves away from expected behaviour.
Observability should give you enough evidence to explore what happened when the explanation is not obvious.
You need monitoring to notice the problem.
You need observability to understand the application well enough to investigate it.
For simple systems, those capabilities may live in almost the same tools and data. As systems become more distributed and harder to reason about, the distinction becomes much more important.
The goal is not to choose between monitoring and observability.
It is to make sure your application can answer both questions that matter in production:
“What is going wrong?”
and
“Why?”